Twenco Analytics & Reporting - (TAR)
Better Data Analytics for test and production processes.
After a test or production run you´ve got data that has to be analyzed and reported.
This is often a time-consuming process that can now be realized in a short time with handy built-in functions.
Testing Data
Validate your product designs more efficiently and eliminate flaws faster.
Optimal process analysis that can be used as input for flow and curing simulation.
Production Data
Access the complete data history to see and compare key operational and product genealogy information.
Analysis functions
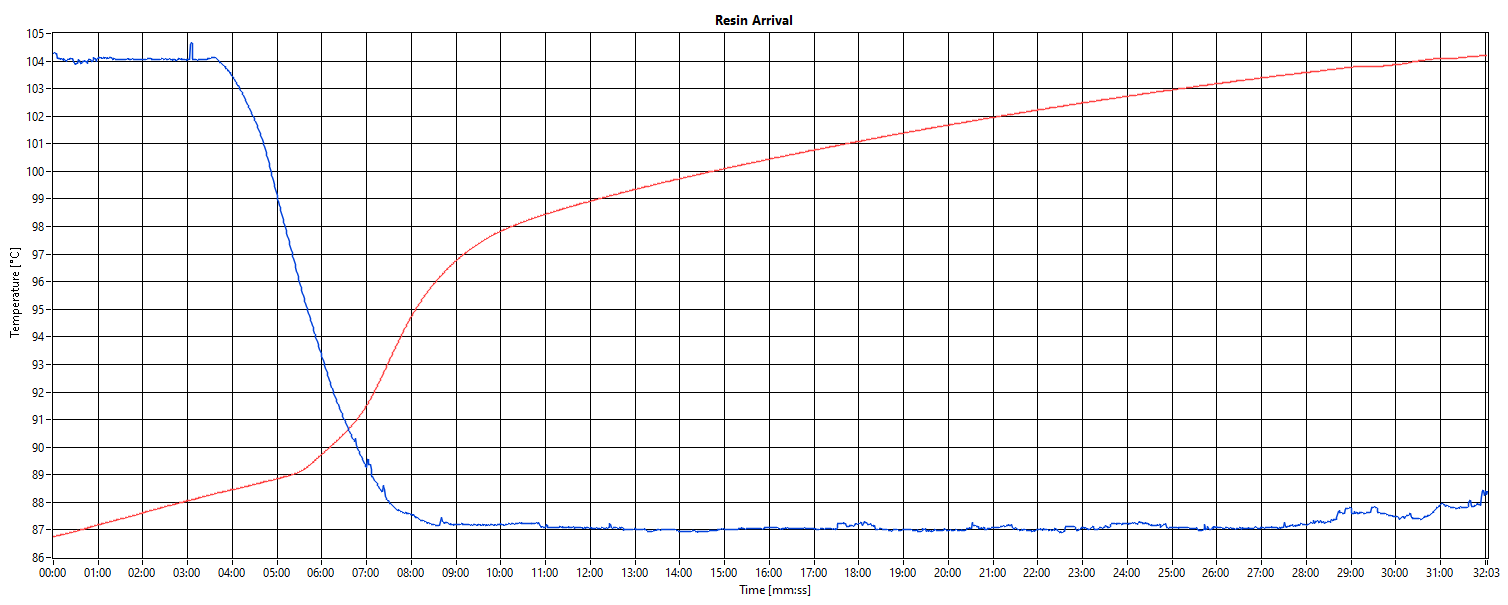
Data points from a measurement can be divided into process steps such as:
- Resin Arrival
- Flow rate
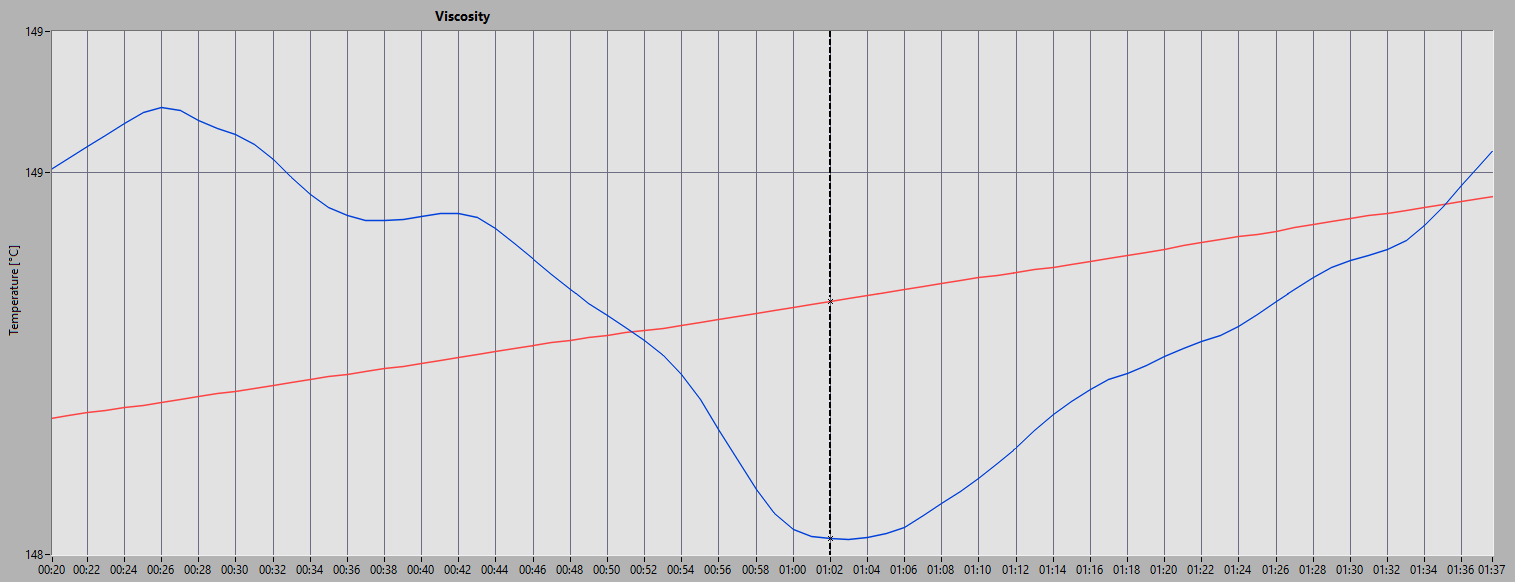
- Highest Viscosity
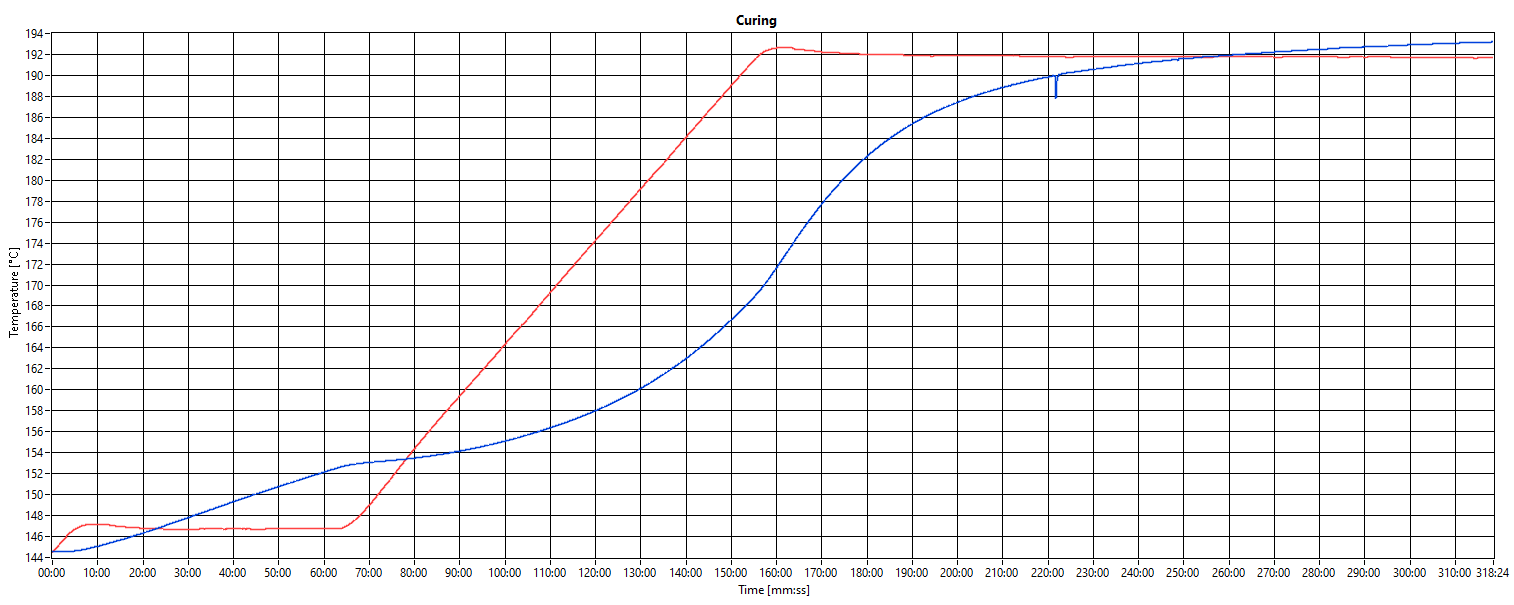
- Curing
After selection, each process step can be zoomed in further.
Historical data from multiple measurements can be shown in 1 graph, but can also be superimposed from the same process starting point, such as Resin Arrival or Highest Viscosity. That makes it easy to detect process differences.
In case of signal disturbances, various filters can be applied to optimize the graph.
In relation to the actual sensor process temperature or the original temperature settings, it is possible to create a graph with the original temperature settings. This graph can then be displayed as an “overlay” in the process graph.
Reporting functions
After or during the analysis of the data, the created graphs can be exported to be used for making a report.